Automated Watchdog RCA | Datadog
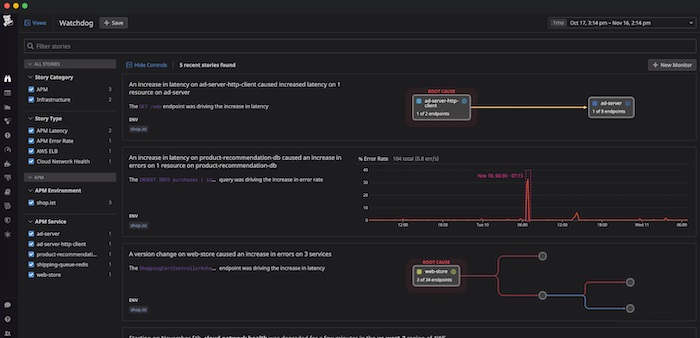
We’re pleased to announce the private beta of Watchdog RCA, which automatically identifies causal relationships between different symptoms across your applications and infrastructure—and pinpoints the root cause.

We’re pleased to announce the private beta of Watchdog RCA, which automatically identifies causal relationships between different symptoms across your applications and infrastructure—and pinpoints the root cause.

When deploying services using Docker it is important to understand resource utilization and identify any potential resource constraints in your containerized infrastructure. As such, you should track Docker events and container status as well as CPU, memory, I/O, and network metrics.

In this article, we will explain how to monitor an Oracle Database with Prometheus using an exporter to generate metrics. Also, we will review the main metrics that you should monitor on resource usage and performance, and what to alert on to detect issues and incidents in your Oracle Database.

Have you ever wanted to try K3s high availability cluster “mode,” and you either did not have the minimum three “spare nodes” or the time required to set up the same amount of VMs? Then you are in for a good treat: meet k3d!

Terraform is the infrastructure as code tool from HashiCorp. It is a tool for building, changing, and managing infrastructure in a safe, repeatable way.

In this article we will take a brief look at some time saving tricks you can use when interacting with the terminal. As a system administrator you will spend most, if not all, of your time in a terminal.

In this tutorial we will take a look at the NGINX Official Docker Image and how to use it. We’ll start by running a static web server locally then we’ll build a custom image to house our web server and the files it needs to serve.